
Command-line tools like htop and df are excellent for quick troubleshooting when you are currently logged into an SSH session. But what if you need historical graphs? What if you want to see exactly how your CPU reacted when a burst of traffic hit your website 2 hours ago?
For that, you need a full monitoring suite.
While enterprise teams rely on complex stacks like Prometheus and Grafana (which are tedious to set up and difficult to configure), there is a radically simpler, instantly beautiful alternative: Netdata.
Netdata installs in a single command, automatically detects all running services (like Nginx, Apache, MySQL, Docker), and instantly generates thousands of real-time metrics presented in a stunning web dashboard.
Step 1: Install Netdata Using the Kickstart Script
Netdata provides an official, universally supported "kickstart" script. This handles identifying your OS architecture, downloading the required package dependencies, and installing the monitoring agent perfectly whether you are running Ubuntu, Debian, AlmaLinux, CentOS, or Fedora.
First, download the script to a temporary folder and execute it:
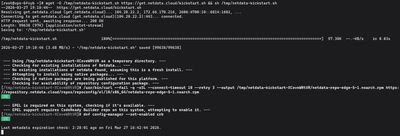
wget -O /tmp/netdata-kickstart.sh https://get.netdata.cloud/kickstart.sh && sh /tmp/netdata-kickstart.sh
The script will prompt you for confirmation. Press Y to confirm.
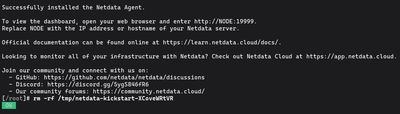
It handles everything invisibly in the background. Once the installation is finished, Netdata automatically registers itself as a systemd service, starts running its daemons, and configures itself to boot whenever your server starts.
To verify it is running smoothly, check the service status:
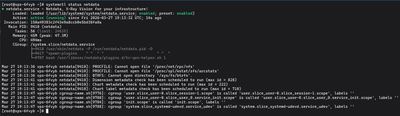
sudo systemctl status netdata
Look for active (running).
Step 2: Configure the Firewall
Netdata creates a lightweight web server strictly for serving its dashboard. By default, this web server listens on Port 19999.
Because you are likely (and should be!) running a firewall, port 19999 is blocked from the public internet. You need to explicitly open it so you can reach the dashboard from your browser.
If you are using UFW (Ubuntu/Debian):
sudo ufw allow 19999/tcp
If you are using firewalld (AlmaLinux/CentOS/Fedora):
sudo firewall-cmd --permanent --add-port=19999/tcp
sudo firewall-cmd --reload
Step 3: Access Your Dashboard
You are completely set up!
Open your favorite web browser and navigate to your server's public IP address, appending the :19999 port number.
http://your_server_ip:19999
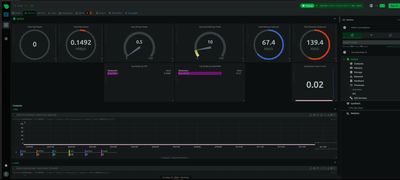
You will immediately be loaded directly into the Netdata Local Dashboard. No passwords, no configurations, no waiting.
Scroll down the right-hand bar. Netdata will have already found and mapped graphs for:
- CPU usage by active core
- Hard drive I/O (read/write speeds)
- Total and available Memory (RAM) handling
- Network bandwidth interfaces
- Interrupts, IPv4 tracking, and even background container (Docker) statistics.
Security Note
By default, Netdata's local dashboard is accessible to anyone who has your server's IP address and knows to append :19999. While they cannot see your passwords or private code, they can map out what software you are running based on identifying the graphs (e.g., admitting you run MySQL to attackers).
If you are running a production server, it is highly recommended to eventually bind Netdata strictly to localhost and access it via a Reverse Proxy (using an Nginx Server Block) with a required password prompt (htpasswd).
However, for a fresh testing or development environment, leaving the port open is fine for rapid monitoring. If you want to dive into complex performance metrics or monitor massive database loads efficiently, grab a remarkably robust Budget VPS, spin up some intense applications, install Netdata, and watch the graphs dance perfectly in real-time.