
When your website slows down or your database suddenly crashes, the first question you need to ask is: "Is my server out of resources?"
You don't need complicated graphing software to answer this. Linux comes with a handful of incredibly powerful, built-in command-line tools that can instantly tell you exactly what is happening under the hood of your Linux server.
Here is the absolute beginner's guide to diagnosing your server's CPU, RAM, and disk storage in seconds.
Step 1: Monitor CPU and Processes with htop
The old standard for checking running programs in Linux is the top command. However, top is ugly and hard to read. Instead, you should use htop. It's colorful, interactive, and much easier for beginners to understand.
If it's not installed on your system, install it:
# On Ubuntu/Debian:
sudo apt install htop -y

# On AlmaLinux/CentOS/Fedora:
sudo dnf install htop -y
Launch it by simply typing:
htop
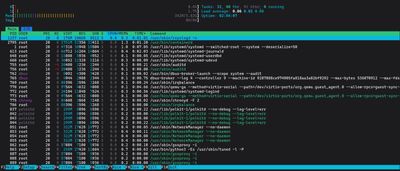
How to read htop:
Look at the very top of the screen.
- Numbered Bars (1, 2, 3...): These represent your CPU cores. If the bars are completely filled up (100%) and colored heavily in red, your server is struggling to process everything being thrown at it.
- Mem (Memory): This shows your RAM usage. The green section is actively used RAM. The yellow/blue sections are cache (which is good—Linux uses empty spare RAM to speed up file access).
- The Process List: Below the bars is a constantly updating list of programs. The %CPU and %MEM columns show exactly which program is eating your resources.
To exit htop, simply press q on your keyboard, or F10.
Step 2: Understand Memory Usage with free
If you just want a quick, clean snapshot of your RAM, you don't need htop. You can use the free command.
Always run it with the -h flag. This stands for "human-readable", which translates the output into easily readable Megabytes (M) or Gigabytes (G) instead of millions of confusing bytes.
free -h
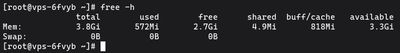
Output example:
               total        used        free      shared  buff/cache   available
Mem:           2.0G        412M        1.2G         15M        400M        1.4G
Swap:            0B          0B          0B
The most common beginner panic:
Often, people look at free and panic because the "free" column is very low. Don't panic.
Look at the available column instead.
Linux purposefully fills empty RAM with cached files (buff/cache) to make your server run faster. If a program suddenly needs RAM, Linux instantly dumps the cache and hands the RAM over. The available column tells you how much RAM is actually available for new applications.
Step 3: Check Disk Space with df
Running out of disk space will completely break your server. Databases corrupt, logs fail to write, and services refuse to start.
To check how much space you have left, use df (Disk Free). Again, use the -h flag for human-readable sizes:
df -h
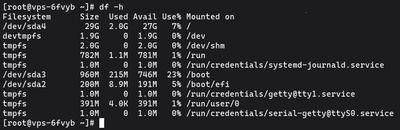
Output example:
Filesystem      Size  Used Avail Use% Mounted on
tmpfs           198M  1.1M  197M   1% /run
/dev/vda1        25G  8.5G   16G  36% /
tmpfs           988M     0  988M   0% /dev/shm
Look at the line where Mounted on is / (the root directory). In this example, the total disk size is 25G, we have used 8.5G, and the disk is 36% full. You are perfectly safe.
Step 4: Find What is Eating Space with du
If df tells you your disk is 99% full, your next question is: "What is taking up all the space?"
Use du (Disk Usage) to find the culprit. Move to the directory you suspect (usually /var/log or a website folder) and run:
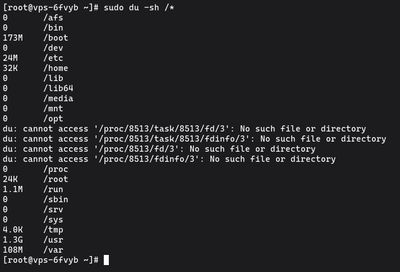
du -sh /*
This will print the size (-s for summary) in human-readable format (-h) of every folder and file in your current location. If you see a massive 15GB error.log file, you've found your problem!
You can also combine it with sorting to easily find the biggest folders. For example, to find the biggest folders in /var/log across the entire server:
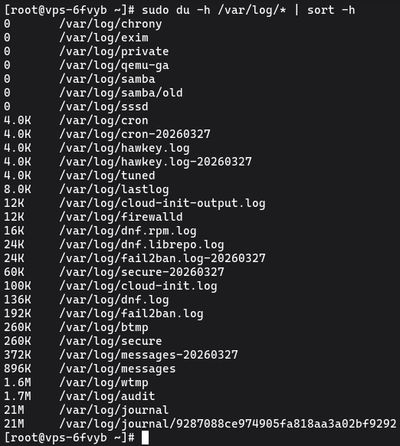
sudo du -h /var/log/* | sort -h
Need more power?
These commands are lifesavers for quickly debugging a slow server over SSH. If you want a beautiful, historical web dashboard instead of terminal tools, check out our guide on How to Set Up Netdata. If you find that your CPU is constantly hitting 100% or your memory available is consistently at 0, your project has officially outgrown your current hardware.
When it's time to scale, check out our highly scalable Premium VPS or reliable Budget VPS options to instantly double your resources and keep your applications running smoothly.